Day trading requires precise decisions and the right tools to analyze market trends. Here are five of the best technical analysis tools to help you trade smarter and manage risks effectively:
- TradingView: Offers customizable charts, real-time data, and a large community sharing trading ideas. Free and premium plans available ($15–$60/month).
- MetaStock: Known for its advanced tools like market scanning, strategy testing, and real-time data integration. Ideal for in-depth analysis.
- TrendSpider: Uses AI to automate charting, pattern recognition, and multi-timeframe analysis. Great for traders seeking automation and efficiency.
- NinjaTrader: Combines advanced charting with direct order execution and tools like Volume Profile and Order Flow Analytics.
- Fibonacci Retracement Tools: Helps identify support and resistance levels using specific price ratios. Included in most trading platforms.
Quick Comparison
| Tool | Best For | Key Features | Cost |
|---|---|---|---|
| TradingView | Beginners & experienced | Custom charts, real-time data, community | Free; Premium $15–$60/mo |
| MetaStock | Advanced analysis | Market scans, strategy testing | Prices vary |
| TrendSpider | Automation & AI tools | Automated charts, multi-timeframe analysis | Prices vary |
| NinjaTrader | Order execution & analytics | Real-time data, order flow visualization | Prices vary |
| Fibonacci Tools | Identifying price levels | Support/resistance analysis | Included in platforms |
Choose tools that match your trading style, start with a demo account, and focus on mastering one or two tools before expanding your toolkit. With the right tools, you can trade more confidently and effectively.
Which SOFTWARE to use for TECHNICAL ANALYSIS ...
1. TradingView

TradingView is a widely-used platform for technical analysis, trusted by over 100 million traders worldwide.
The platform offers highly customizable charts, allowing day traders to create layouts with multiple timeframes and indicators - perfect for tracking fast-moving markets.
Its mobile app, boasting a 4.9-star rating from 1.5 million reviews, makes it easy to monitor and execute trades anytime, anywhere.
A key feature is its active community, which has shared more than 10 million custom scripts and trading ideas. These contributions provide a wealth of strategies and indicators to improve analysis.
TradingView also provides real-time data for major indices, as shown below:
| Index | Coverage Type |
|---|---|
| S&P 500 | Real-time data |
| Nasdaq 100 | Real-time data |
| Dow 30 | Real-time data |
| Japan 225 | Real-time data |
| FTSE 100 | Real-time data |
| DAX | Real-time data |
For traders navigating high-speed markets, TradingView combines advanced tools with an easy-to-use interface, constantly updating with features shaped by its users.
2. MetaStock
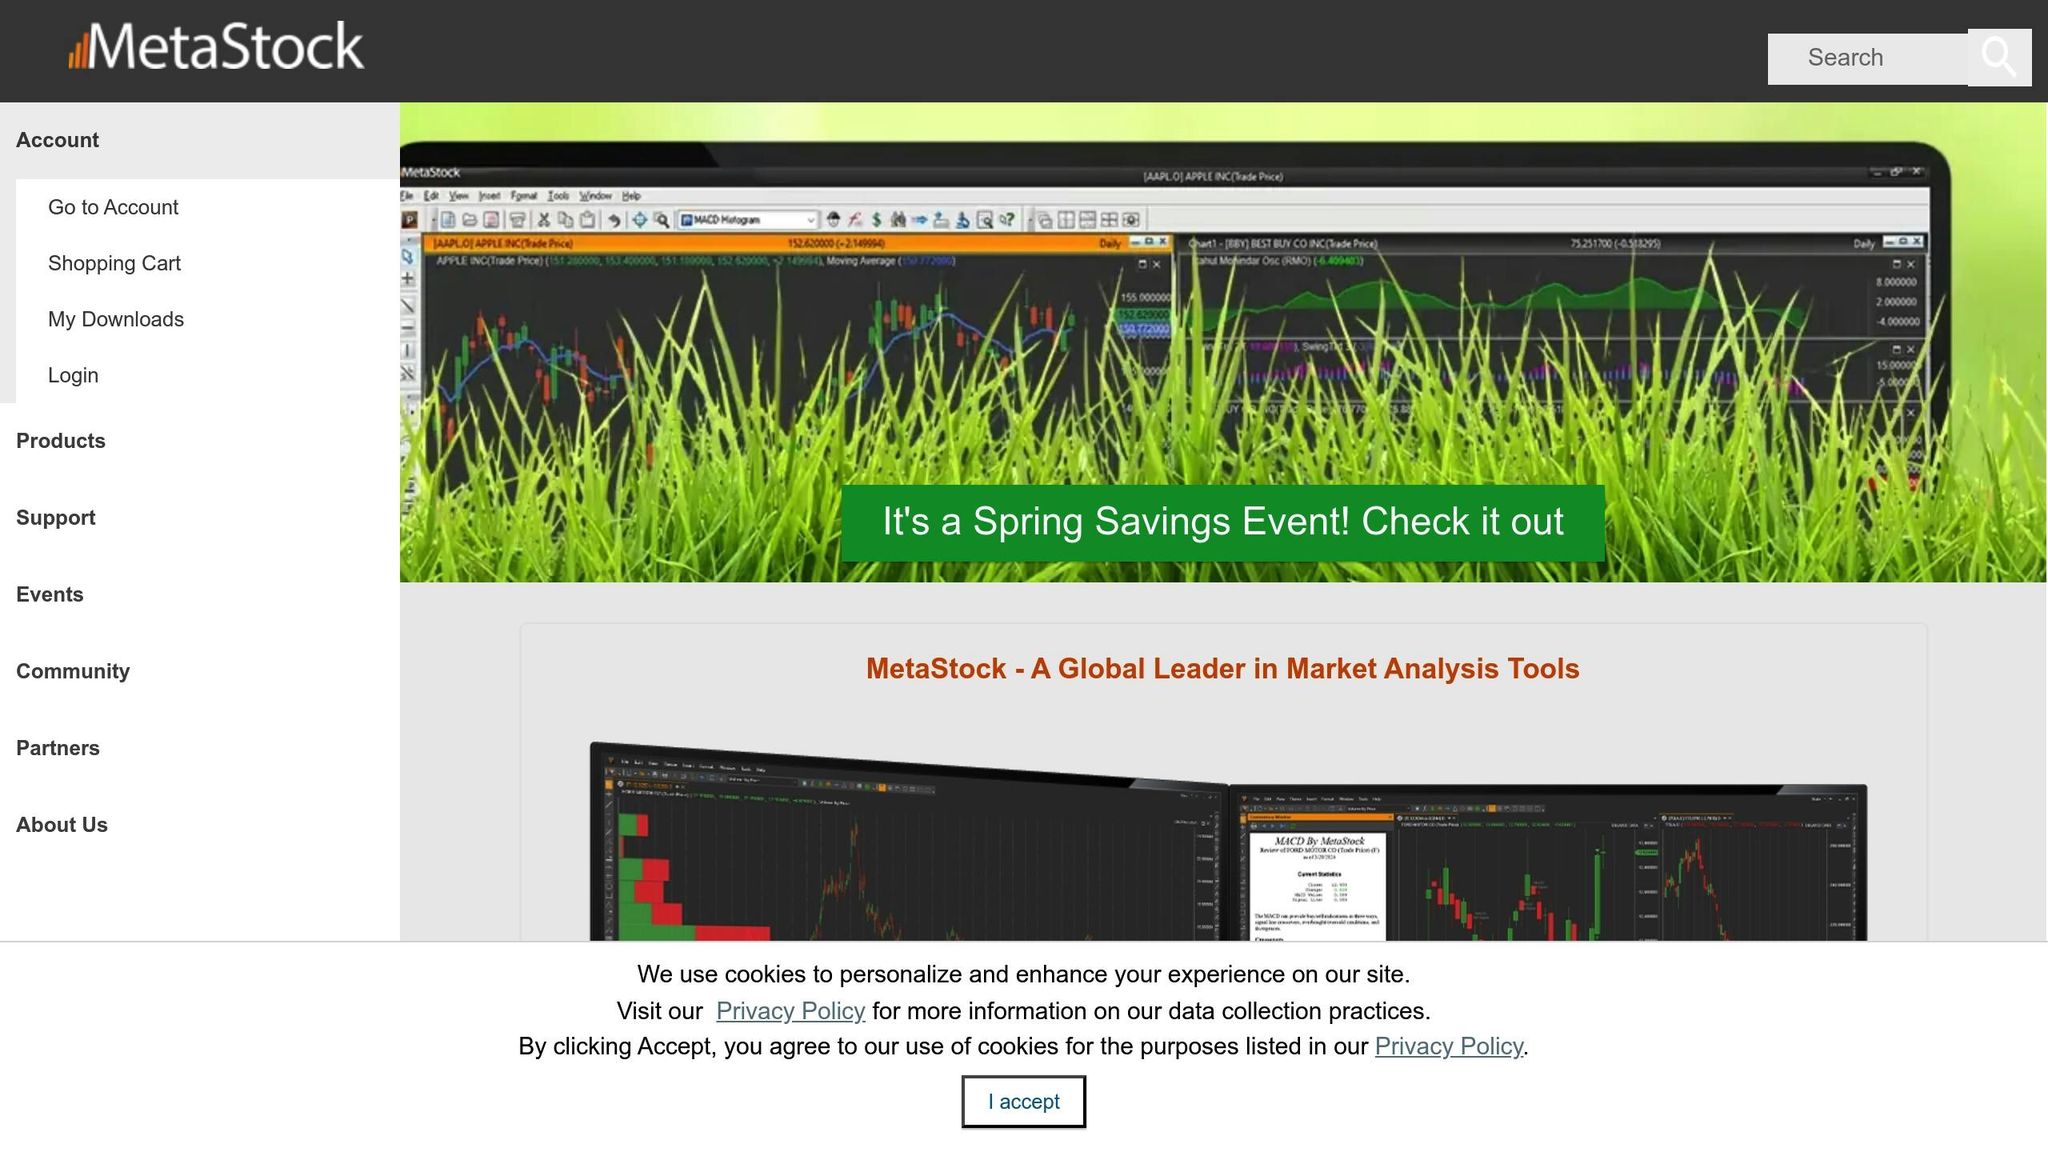
MetaStock brings over 30 years of expertise in charting and analysis. Its flagship product, MetaStock R/T powered by XENITH, caters to day traders who rely on real-time insights.
The platform includes a powerful suite of tools, known as PowerTools, designed to enhance day trading strategies:
| Tool | Function | Benefit |
|---|---|---|
| Explorer | Market scanning | Pinpoints buy/sell signals using custom criteria |
| System Tester | Strategy validation | Tests trading systems before live use |
| Expert Advisor | Signal generation | Offers real-time trading signals |
| FORECASTER | Price prediction | Aids in setting precise stops and profit targets |
These tools combine real-time data with market scans, enabling quick and informed decision-making.
"MetaStock is a charting software tool for traders to analyze the markets. It uses technical analysis to help traders take the guesswork out of trading by offering a methodical, systematic approach to selecting which securities to trade and when." - MetaStock
MetaStock is well-suited for analyzing multiple markets, supporting a variety of instruments such as stocks, options, commodities, e-Minis, FOREX, and futures. This flexibility is a key advantage for day traders managing diverse portfolios.
By integrating with XENITH, MetaStock R/T offers:
- Real-time data streams
- Breaking news alerts
- Advanced analytics
- Access to professional commentary
The FORECASTER tool further enhances trading by helping traders fine-tune their stops and profit targets for better timing.
Next, we’ll dive into TrendSpider’s dynamic market analysis approach.
3. TrendSpider
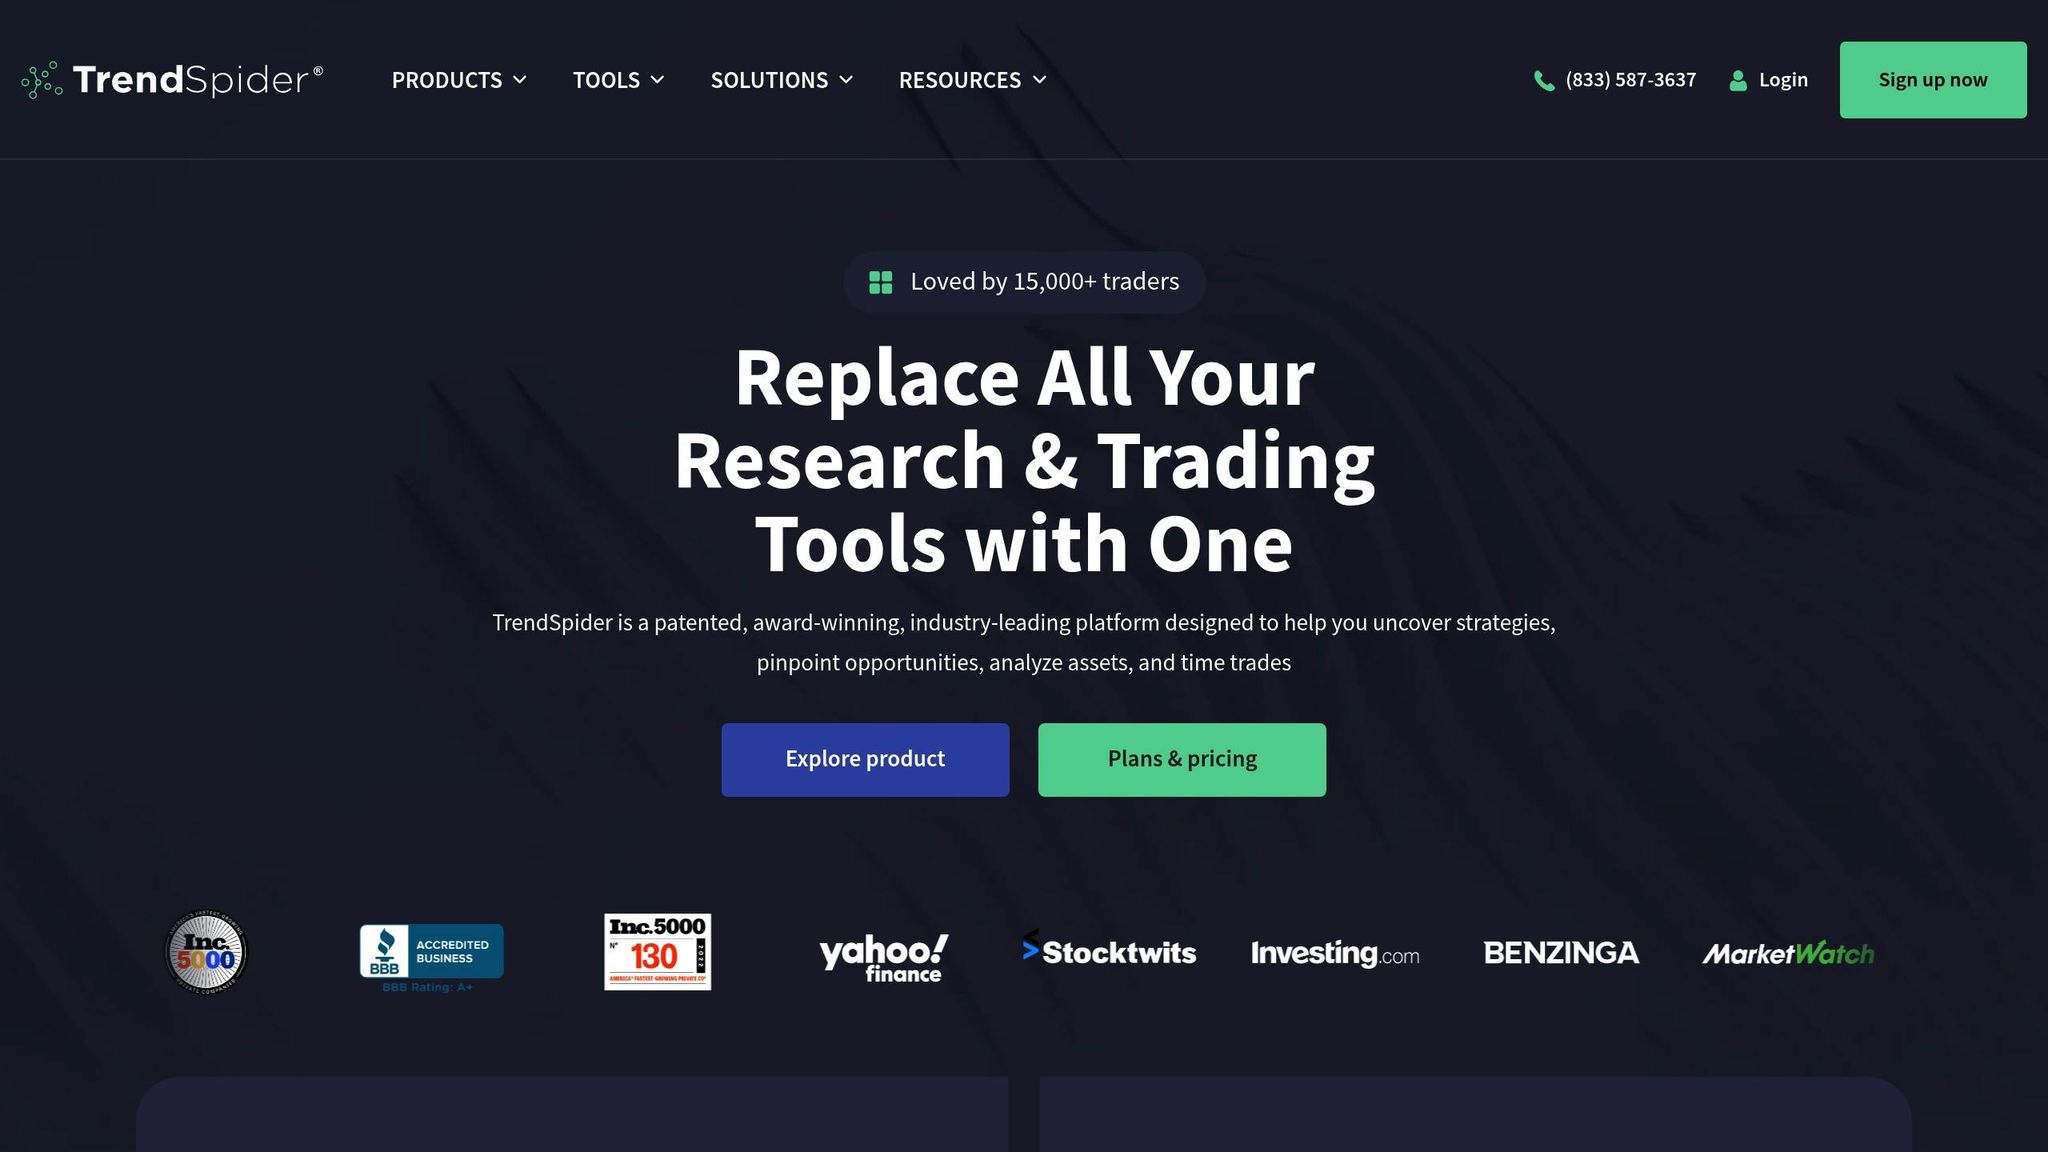
TrendSpider is an AI-driven platform designed for technical analysis, offering access to over 55,000 assets. Its standout feature, Smart Charts, automatically evaluates market conditions and highlights key patterns, making market analysis more efficient.
The platform includes several powerful automation tools:
| Component | Function | Trading Advantage |
|---|---|---|
| Automated Pattern Recognition | Uses mathematical models to detect chart patterns and trendlines | Reduces guesswork |
| Multi-timeframe Analysis | Examines multiple timeframes at once | Delivers a broader market perspective |
| Dynamic Price Alerts | Tracks price changes and triggers automated actions | Improves timing for trades |
With its AI Strategy Lab, traders can create strategies without coding and design custom indicators tailored to the platform's analytics. A 50-year historical database enables in-depth backtesting for informed decision-making.
TrendSpider also introduces Raindrop Charts, offering unique visualizations, and automated trendline analysis to identify support and resistance levels, helping traders avoid emotional decisions.
The platform supports real-time monitoring across various asset classes, including stocks (real-time data), cryptocurrencies, forex pairs, and futures and indices (delayed data). Its built-in scanner and advanced charting tools help traders quickly identify opportunities. Additionally, free technical support is available during NYSE market hours for timely assistance.
TrendSpider's automation tools simplify charting and scanning, allowing traders to concentrate on strategy execution and managing risks effectively.
sbb-itb-2e26d5a
4. NinjaTrader
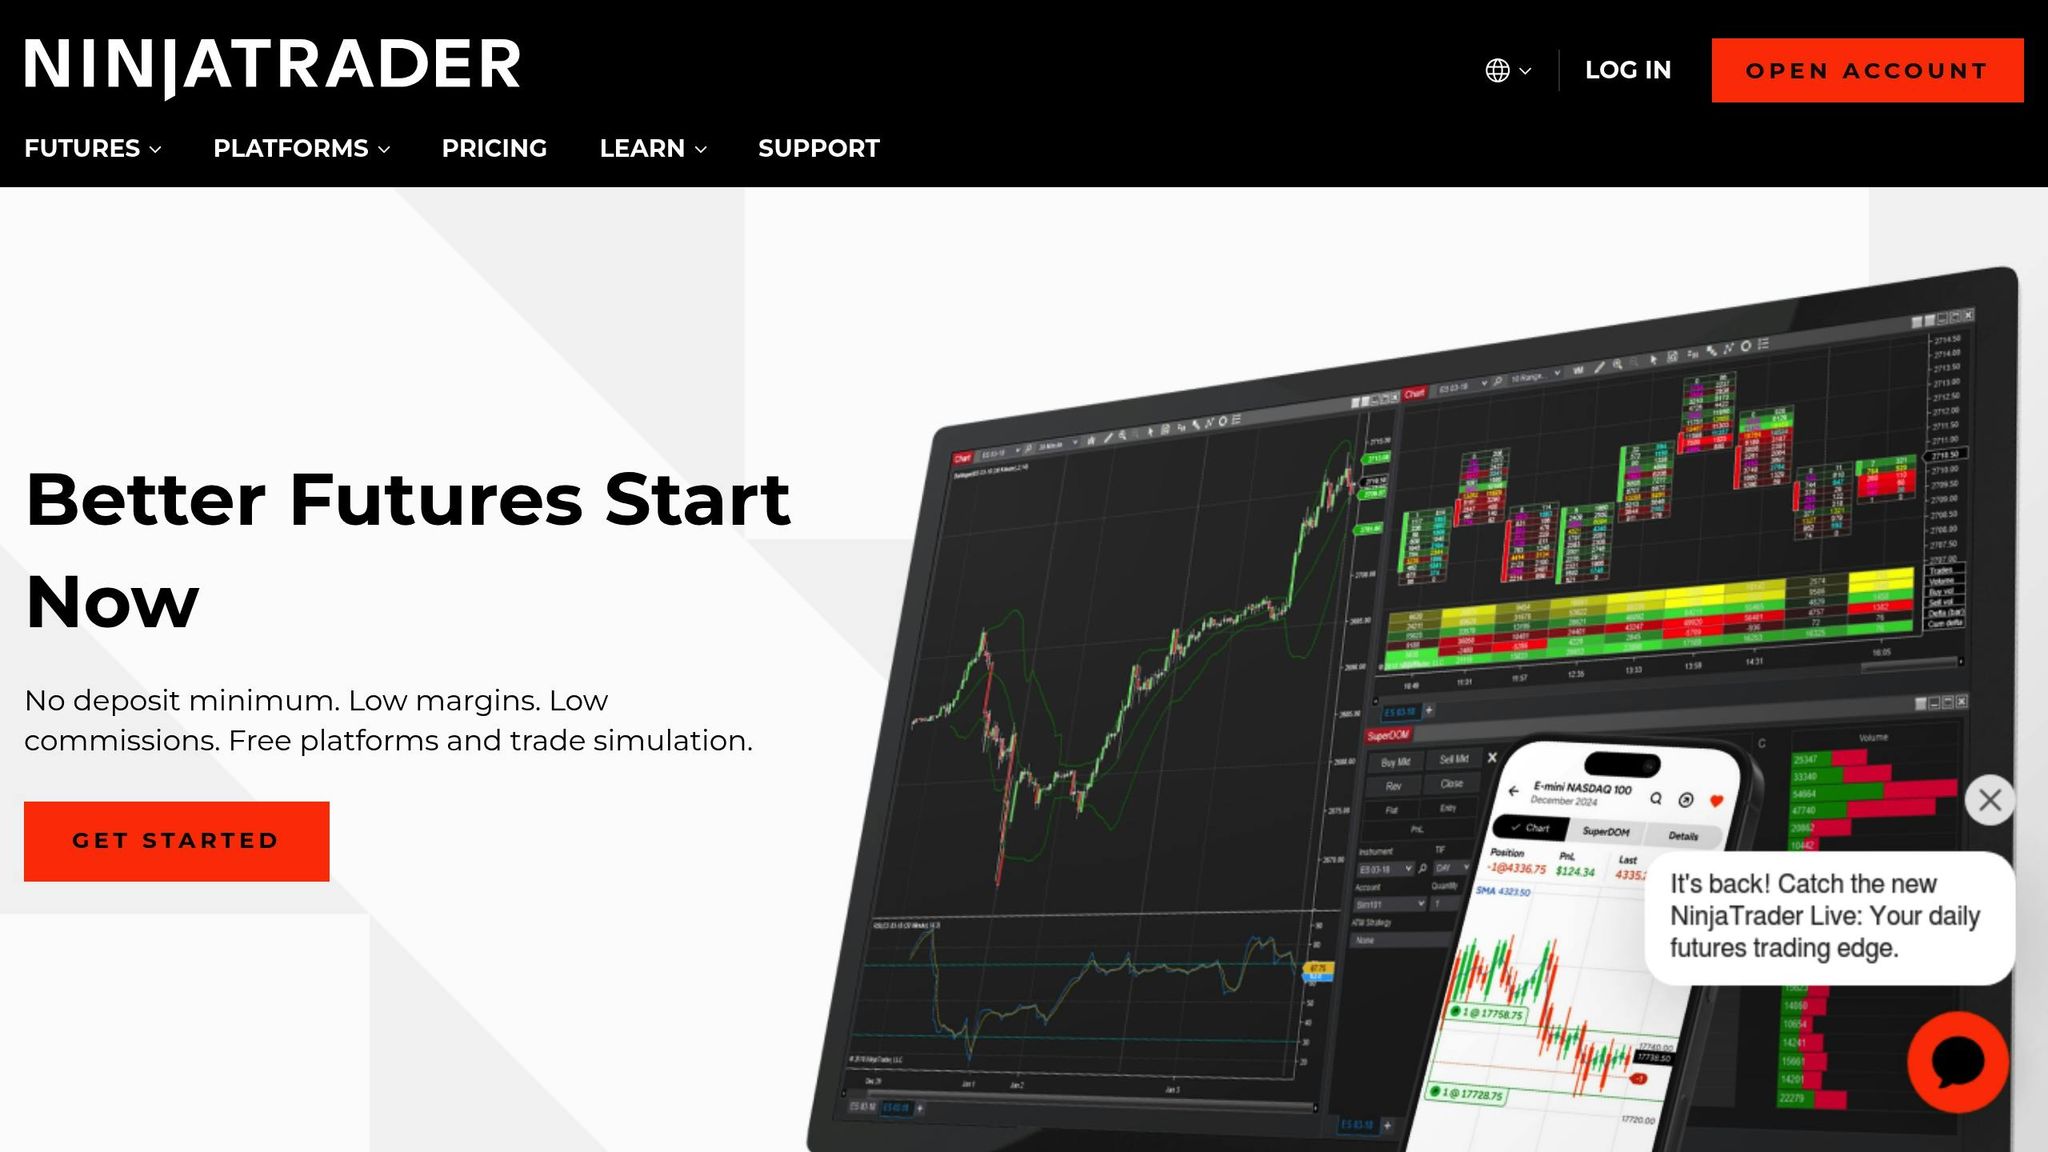
NinjaTrader offers advanced charting tools combined with efficient order execution, making it a strong choice for day traders. Its Chart Trader feature lets you place orders directly from charts, making it easier to move from analysis to action. The platform's SuperDOM provides real-time order flow visualization, helping you spot price movements quickly.
NinjaTrader is designed for day trading and works seamlessly with major data providers like CQG, Kinetick, and IQFeed. This ensures you get reliable, real-time market data. The platform also supports multiple brokers, giving you consolidated access to the markets. Beyond data integration, NinjaTrader includes tools that help improve trading decisions.
Features like Volume Profile, Order Flow Analytics, and ATR (Average True Range) provide deeper insights. These tools help you analyze trading volume at key price levels, track order flow trends, and calculate position sizes and stop levels more effectively.
5. Fibonacci Retracement Tools
Fibonacci retracement tools break down the range between two extreme price points into specific ratios: 23.6%, 38.2%, 50%, 61.8%, and 100%. Day traders often focus on the 61.8% and 38.2% levels for identifying support and resistance. The 50% level, while not a true Fibonacci ratio, is frequently used to gauge momentum continuation. Here’s how you can make the most of these tools:
- Market Conditions: Use Fibonacci retracement in trending markets. Avoid applying it during sideways or highly volatile periods.
- Timeframe Analysis: Spot major levels on weekly charts, then fine-tune your entry and exit points with daily and intraday charts.
- Confirmation Strategy: Pair Fibonacci levels with other indicators like moving averages, Bollinger Bands, RSI, or stochastic oscillators for better accuracy. If the price moves beyond the 0% or 100% levels, the retracement becomes invalid.
Here’s a quick guide to applying Fibonacci retracement in different market scenarios:
| Market Condition | Fibonacci Application | Action Steps |
|---|---|---|
| Uptrend | Draw from significant low to high | Monitor for price bounces at retracement levels |
| Downtrend | Draw from significant high to low | Look for resistance at retracement levels |
| Consolidation | Not recommended | Wait for a clear trend to develop |
Tool Comparison Chart
| Tool | Entry-Level Option | Key Features |
|---|---|---|
| TradingView | Free version; Premium plans from $15–$60/month | Easy-to-use interface with advanced charting |
| MetaStock | Prices vary | Built for in-depth technical analysis |
| TrendSpider | Prices vary | Advanced analytics and automation tools |
| NinjaTrader | Prices vary | Strong trading and execution capabilities |
| Fibonacci Tools | Included in most charting platforms | Helps track and confirm market trends |
This chart gives a quick overview of popular tools and their standout features. For beginners, TradingView is a great starting point with its free option and affordable plans. More experienced traders might lean toward tools like MetaStock or TrendSpider for their advanced functionalities.
When choosing, keep in mind potential extra costs like data feed fees, account minimums, or training materials. Assess these details carefully to ensure the tool fits your trading style and budget.
Next Steps
Start building your trading toolkit today. Select tools that align with your trading style and goals.
Identify your target markets - whether it's stocks, ETFs, options, or cryptocurrencies - and make sure your tools are compatible. For instance, if you're mainly trading stocks, TradingView's Pro+ plan at $12.95/month provides solid stock analysis features and real-time data.
"It's not about having the best tools for trading, it's about having the right combination of trading tools." - Lincoln Olson, Head of Content, WallStreetZen
If you're new to trading, try this step-by-step approach:
- Open a demo account to practice without risking money.
- Focus on mastering one or two technical indicators before expanding your toolkit.
- Keep a trade log to analyze and improve decision-making.
Use these strategies to build confidence before trading with actual funds.
Hands-on experience is key. Try simulators to fine-tune your strategies and manage emotions, helping you make quick, informed decisions. As you grow, combine multiple indicators - like price, trend, momentum, and volume - for a clearer market picture. This approach can help confirm trading signals and uncover potential opportunities.